Trimmed mean.
Intro
A trimmed mean is calculated from a list of numbers that have had their min and max outliers removed.
If you had a list of ages for a primary school class and the standard deviation was 8 you would expect to find.
-
People that are much younger than what the average age would tell you.
-
People that are much older than what the average age would tell you.
A trimmed average would help normalize the distribution by removing the above outliers.
The average would then reflect a more accurate central tendency of age distribution.
Latency
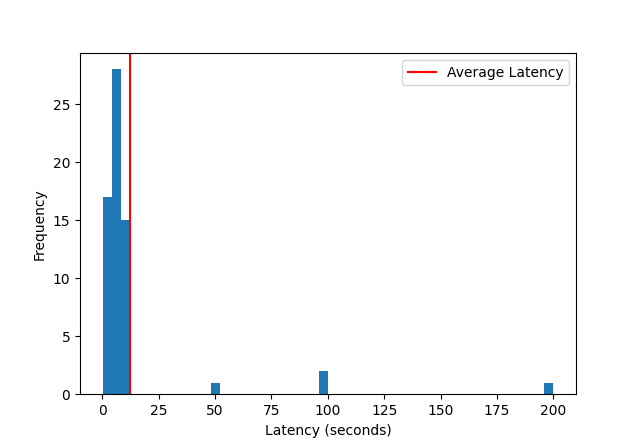
If you have a latency graph for your service that is using mean but not trimmed mean it may look like the below graph.
Using a trimmed mean it will look like below.
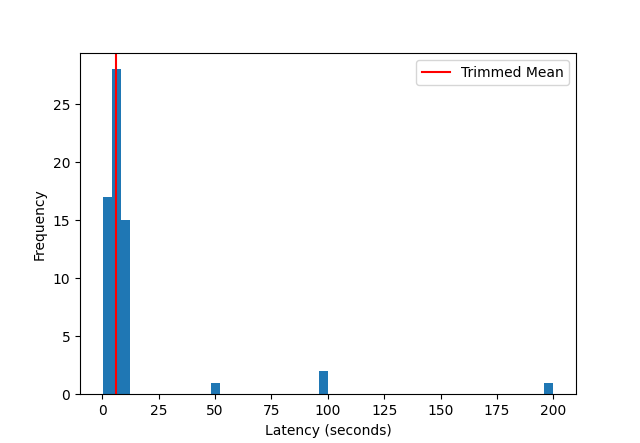
In the trimmed mean graph the average aligns with the most frequent number. In the mean graph the average is skewed to the right.
This is the effect that outliers have when using a simple average calculation.
Outro
If your data set is affected by outliers you can use a median or trimmed mean.
Percentiles, which is what people are using when they refer to P99 on a graph, is another tool you can use. Percentiles do not inherently protect you from outliers.
You should not put all your eggs into a single function or measure. You need to find the right one for the context you are working in.