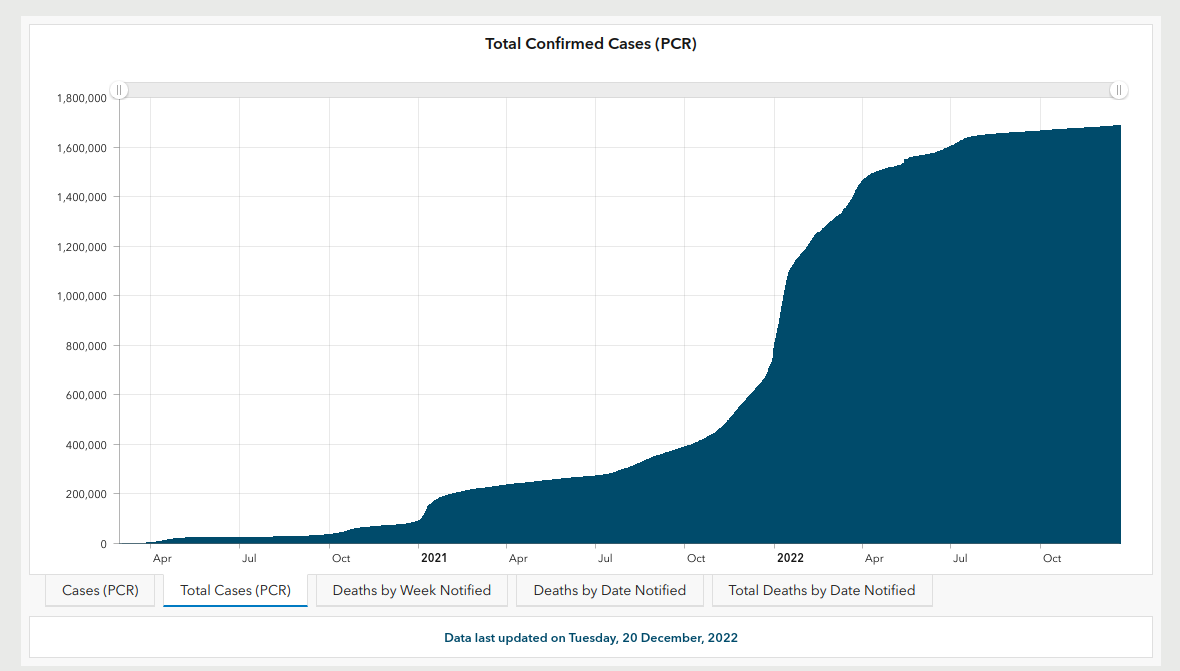
 A graph of PCR confirmed COVID-19 cases in the Republic Of Ireland showing a growth rate close to exponential and then trending towards linear. Source
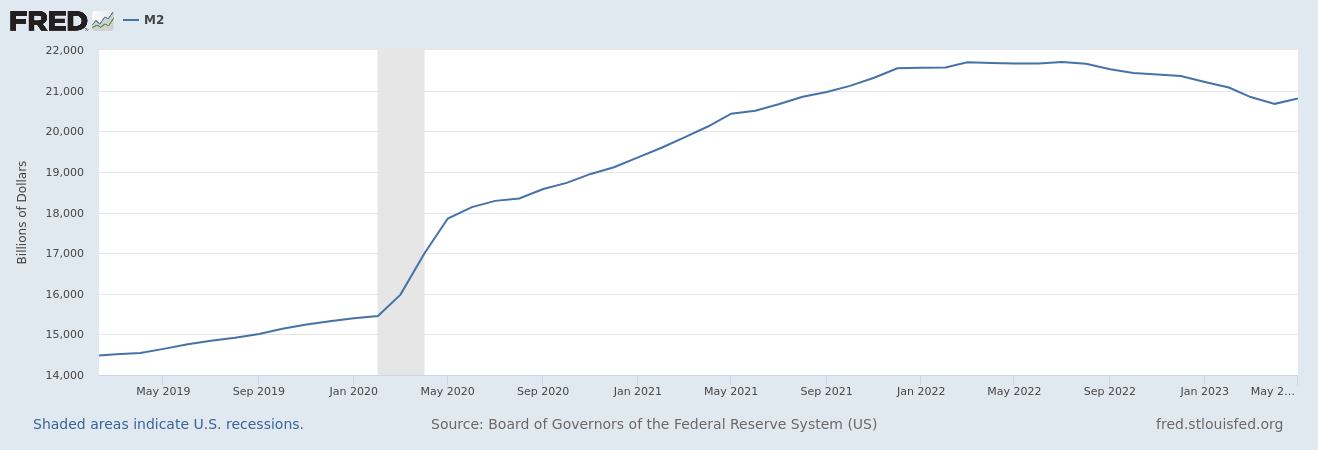 An indication of how much cash exists in the economy, which includes highly liquid assets. Does not mean it is flowing. Used to forecast inflation. Source
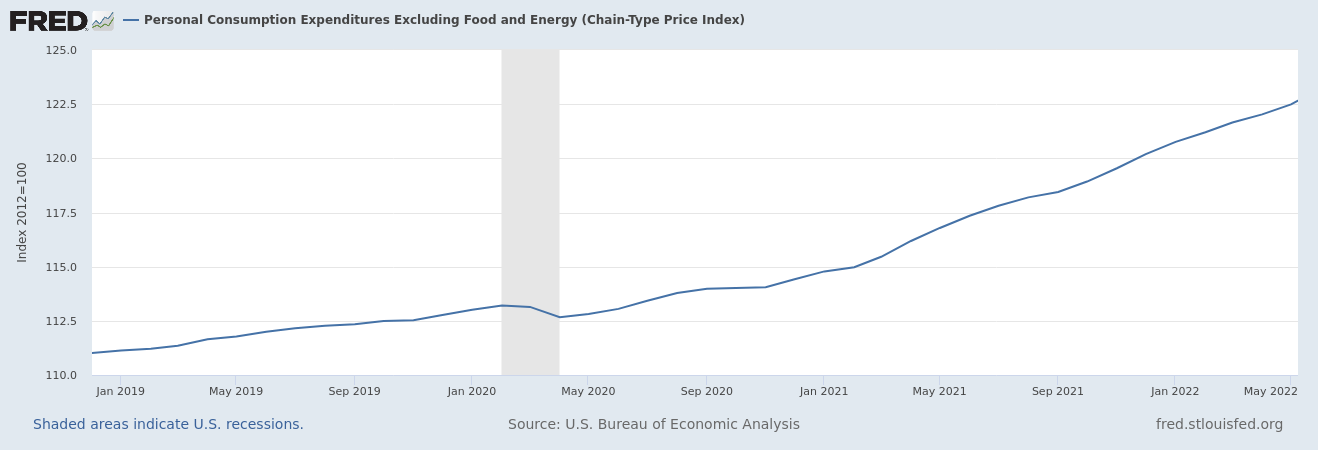 A measure of inflation that does not include energy or food. It is generally what the U.S. FED looks at. Source
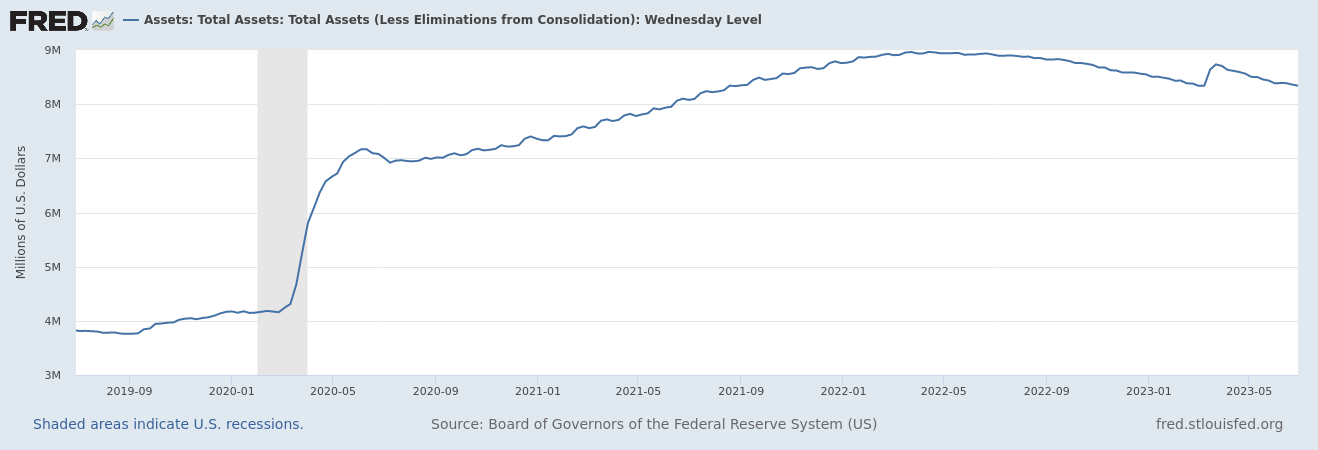 Increasing = Quantative easing. Decreasing = Quantative tightening. Source
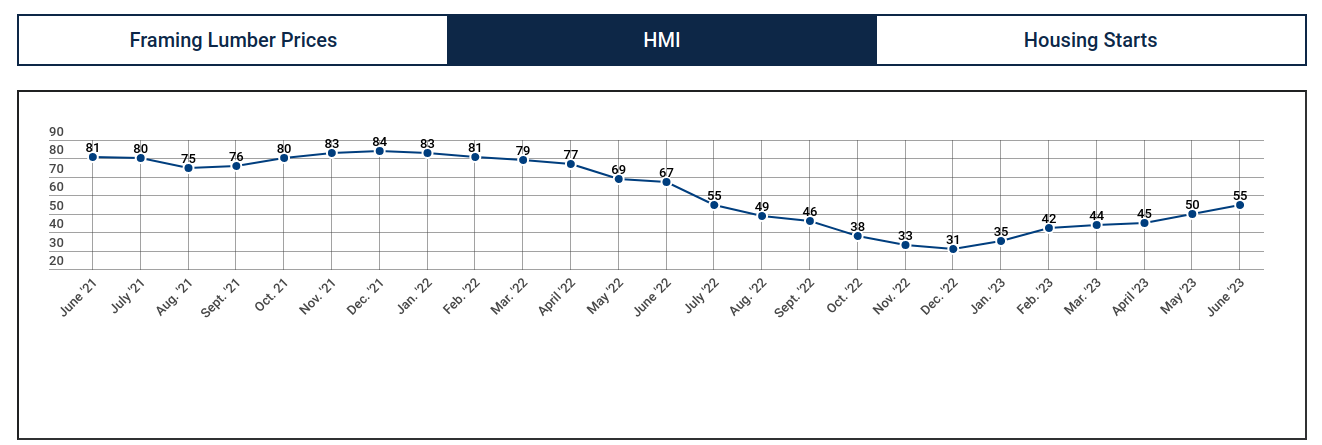 The HMI offers an insider’s perspective on the current state of housing. Each month, builder sentiment about the present and near-term housing market is depicted on a scale of 0 to 100, indicating the portion of builders experiencing positive market conditions. Source
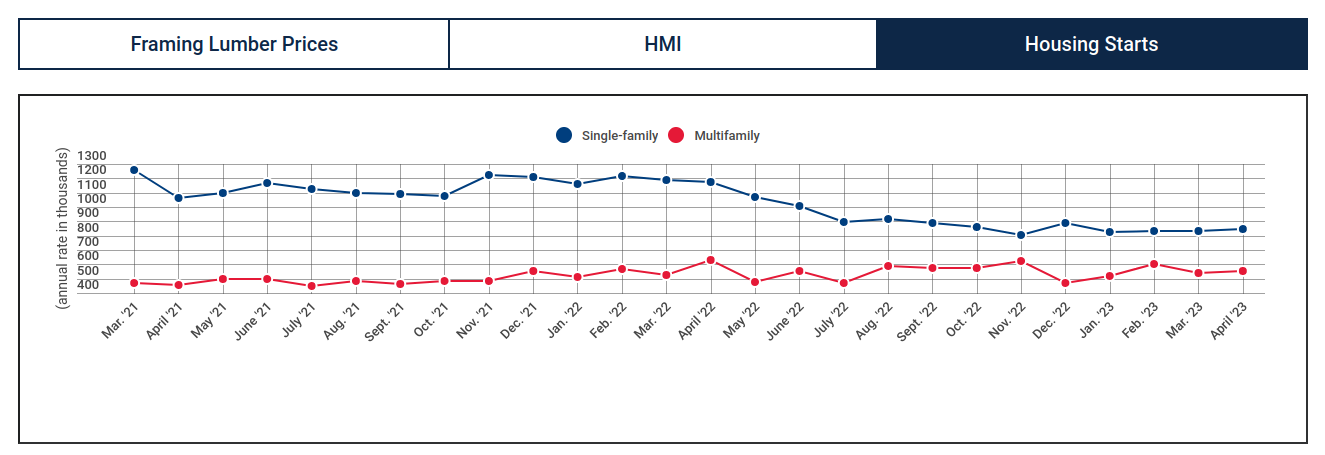 Housing starts data are key economic indicators that track the pace of residential construction. These monthly Census Bureau statistics typically reflect broader trends within the overall economy such as interest rates and job growth. Source
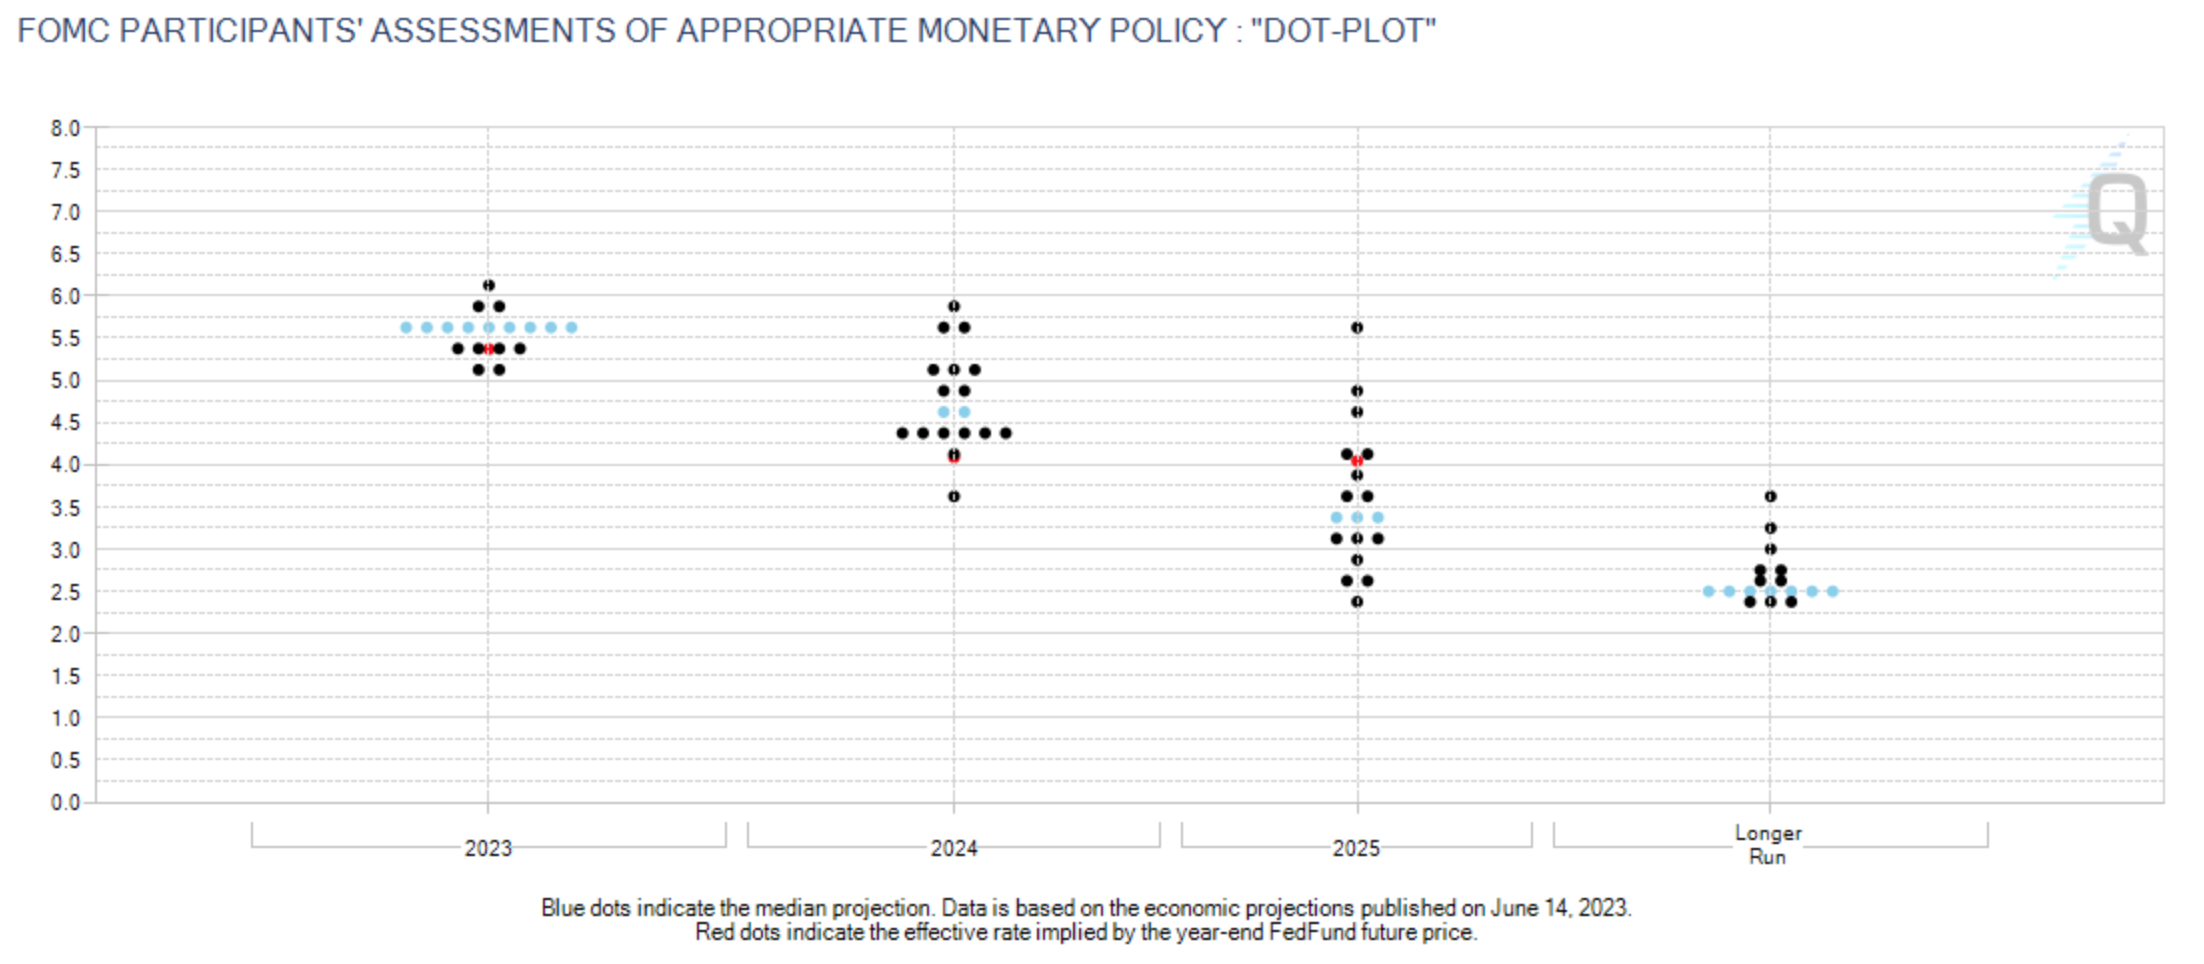 Forecast of where U.S. government interest rates are likely to go. Source
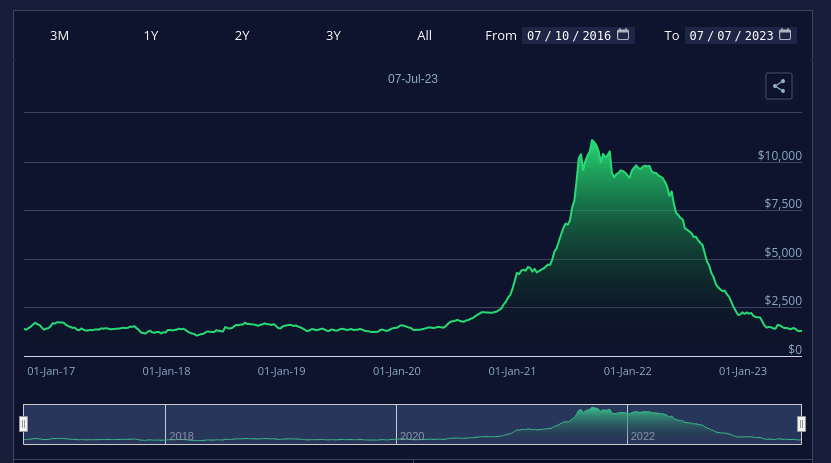 How expensive it is to ship a container internationally. Source
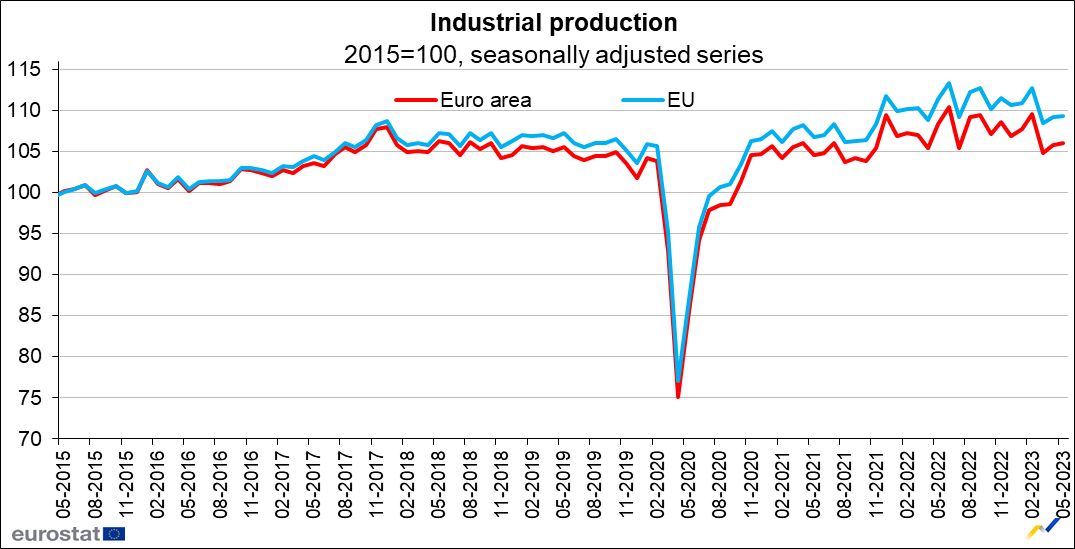 PPI for Euro Area. Basically a manufacturing eqivalent to consumer spending. Source
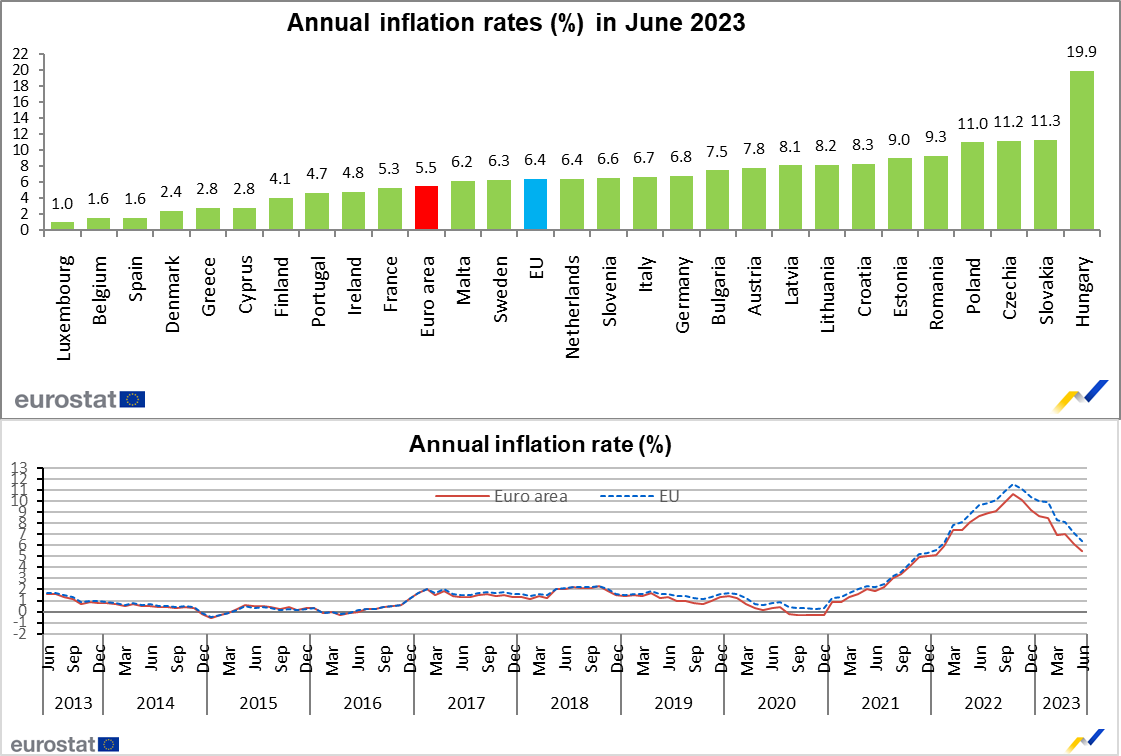 Annual inflation rate for euro area. Ireland below the euro area average. A metric in which being below average is a good thing. Source